Monday
Monday: Compare Two Functions
Two clear cups sit under two dripping jugs at the Puzzle Post. A kitchen timer ticks between them.
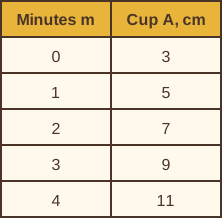
"Cup A, I wrote a table," Raven says. "Every minute I marked the water: 3, 5, 7, 9, 11 centimeters."
"Cup B, I wrote a rule," Rocket says. "Height = 3 × minutes + 1. Mine fills faster."
"What do you notice about how each one started?" Raven asks.
Rocket looks again. "Yours started at 3. Mine started at 1. But mine rises 3 every minute and yours rises 2."
Nova hovers between the cups, her light flicking from table to rule. "Two different forms," she says. "Same two questions."
"How fast, and from where," Raven says. Nova hums. "Rate of change, and initial value."
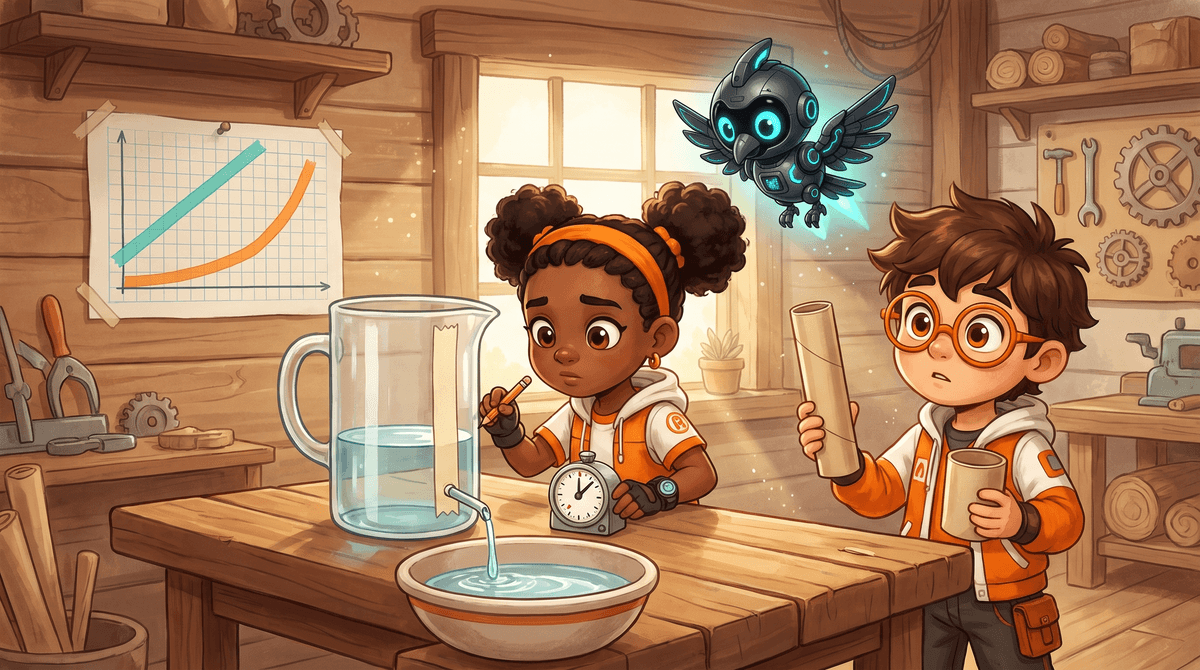
Two questions for every function
A linear function is a rule y = mx + b. Two numbers tell its whole story.
The rate of change, m, is how much y changes for each 1 of x. It is the slope of the line.
The initial value, b, is the y when x = 0, the starting amount. It is where the line crosses the y-axis.
Different forms, same questions
Cup A comes as a table. Each minute adds 2 cm, so the rate of change is 2. At 0 minutes it had 3 cm, the initial value.
Cup B comes as a rule, h = 3m + 1. The rate of change is 3, the number multiplying m. The initial value is 1.
Cup B has the greater rate of change. Cup A has the greater initial value. Both are linear functions.
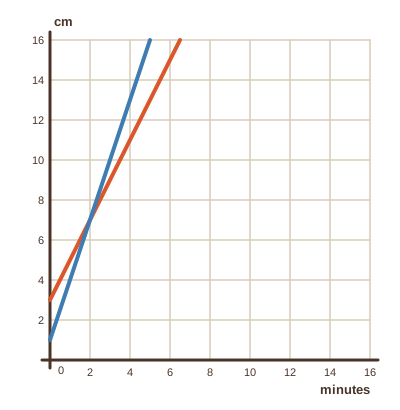
On the graph, Cup B is the steeper line because its rate of change is bigger. Cup A starts higher on the axis.
To compare two functions, bring each one down to its two numbers, however it is written.
- Read the question.
- Tap your answer.
- Read the question.
- Tap your answer.
| Statement | True or false? |
|---|---|
| The rate of change of a linear function is its slope. | ? |
| The initial value is the y when x = 0. | ? |
| A table and a rule cannot be compared. | ? |
| In h = 3m + 1, the initial value is 3. | ? |
Write your rate of change in cm per spoonful and your initial value. Work over a tray.
Two numbers for every function. Tomorrow you meet a function that is not a straight line at all.