Week 12 · Seedling Heights and the Open House
Garden Day
Garden Day: the Open House
// From a sample to the whole bench
⏱ about 20 min
Garden Day: The Open House
String lights glow along the roof beams, and neighbors drift between the benches with their coats still on.
"Two hundred seedlings," Comet tells a visitor, pointing at the bell on the chart. "We measured ten. The curve says about 136 are between 14 and 18."
"How do you know without measuring them?" the visitor asks.
"We do not know. We estimate," Wren says. "A random sample, a mean, a spread, and a model. And a margin, right here."
A child counts flags on the two-way table. "Misted daily sprouted more." "In our tray," Comet says. "We assigned it by coin."
Nova hovers under the lights. "Would you like a hint? Every chart here says exactly what the crew did."
"Twelve weeks of Glass House math," Wren says. "Now show them yours."
- Mean and standard deviation set a normal model; 68%, 95% and 99.7% lie within one, two and three standard deviations.
- A sample survey describes, an experiment may claim cause, an observational study shows a link.
- A simulation shows what chance alone produces. A result chance almost never gives is surprising.
- Margin of error = 2√(p(1 - p)/n) from the crew's simulation rule. Report a sample percent with its margin.
- Compare two treatments with a shuffle test. A difference beyond the shuffles is significant.
- Read every report by asking who was measured, how they were chosen, what was assigned, and whether the sentence matches the number.
◇ YOUR OPEN HOUSE
Set out your three charts: the growth chart from the duckweed weeks, your two-way table, and your seedling-height curve.
Walk your family through each one. Say what was measured, how it was chosen and what each chart claims.
Let a family member ask the four questions from Friday about one chart. Answer each one.
Together, pick one claim you could make stronger next spring, and write how: a bigger sample, a coin, or a new tray.
Walk your family through each one. Say what was measured, how it was chosen and what each chart claims.
Let a family member ask the four questions from Friday about one chart. Answer each one.
Together, pick one claim you could make stronger next spring, and write how: a bigger sample, a coin, or a new tray.
For a grown-up
Charts go on a table or the floor, not a ladder. Nothing heavy is moved alone.
Ask "how do you know?" at least once. The best answer names a sample, a model or a coin flip.
Every number on the charts is the family's own, like the crew's Glass House log. Nothing is a fact about plants in general.
Ask "how do you know?" at least once. The best answer names a sample, a model or a coin flip.
Every number on the charts is the family's own, like the crew's Glass House log. Nothing is a fact about plants in general.
OPEN HOUSE CHECK
- Read the question.
- Tap your answer.
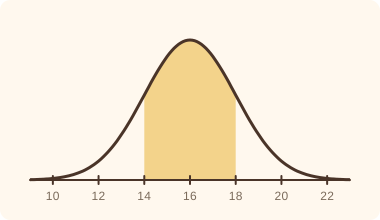 Heights follow a normal model with mean 16 and standard deviation 2. About what percent are between 14 and 18?
The chart says about 68% of the 200 seedlings are within one standard deviation. About how many is that?
The crew flipped a coin for each cell to decide daily or weekly misting, then compared heights. What kind of study is this?
The crew's sample mean is 16 cm and the standard deviation is 2 cm. What height is one standard deviation above the mean? Type the number.
Add the standard deviation to the mean.
WHY THIS EXERCISEThe tick marks on the bell are the mean plus and minus whole standard deviations. They are where the percentages live.
Draw your Open House table as you set it up: three charts, the index card of four questions, and the visitors.