Monday
Monday: Three Numbers, One Wave
Sunset pours through the glass as Comet cranks the roof vents open, a grown-up steadying the ladder.
Wren spreads Nova's temperature log across the bench. "Every six hours, all week. What do you notice?"
Comet reads down the column. "20, 26, 20, 14, 20. Then it starts over."
"It goes up, comes down, dips under, and comes back," Wren says. "Like a wave."
Nova projects the five points joined by a smooth curve. "Would you like a hint? Week 9's sine curve did this too."
"Then we can write a rule for it," Comet says. "The high, the low, and how long before it repeats."
"Amplitude, midline, period," Wren says. "Three numbers, one wave. Our Glass House model, from our own log."

The crew's vent-timer log
Every number in this table is the crew's own made-up reading from Nova's log. Hour 0 is the morning reading.
A pattern that repeats at a steady spacing is called periodic. The temperature wave repeats every day.
| Hours after the morning reading | Temperature (°C) |
|---|---|
| 0 | 20 |
| 6 | 26 |
| 12 | 20 |
| 18 | 14 |
| 24 | 20 |
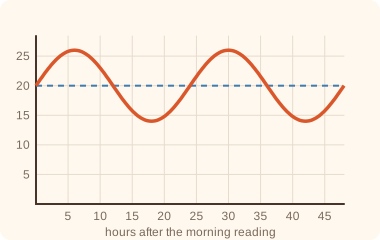
A solved problem to study
Here is how Wren reads the three numbers from the table.
- The highest reading is 26 and the lowest is 14.
- Amplitude: half the distance from low to high. (26 - 14) ÷ 2 = 6.
- Midline: the average of high and low. (26 + 14) ÷ 2 = 20.
- Period: the wave is back at 20 and rising at hour 24. So the period is 24 hours.
- The wave starts at its midline and rises, like sin x. So the model is y = 6 sin(bx) + 20.
- The number b makes one full turn (2π) fit in 24 hours: b = 2π ÷ 24 = π/12.
- The crew's model: T(t) = 6 sin((π/12)t) + 20.
Check it at hour 6: (π/12) × 6 = π/2, and sin(π/2) = 1. So T(6) = 6 × 1 + 20 = 26. It matches the log.
A model is the crew's own fit to their readings. It is not a law about weather, and another week may need new numbers.
- Read the question.
- Tap your answer.
- Read the question.
- Tap your answer.
| Statement | True or false? |
|---|---|
| The amplitude is the distance from the low all the way to the high. | ? |
| (26 - 14) ÷ 2 = 6 | ? |
| (26 + 14) ÷ 2 = 20 | ? |
| The midline is the average of the highest and lowest values. | ? |
| The crew's model is a law that every greenhouse follows. | ? |
Draw the dashed midline at 20. Check that the curve rises 6 above it and dips 6 below it.
Strong start. Tomorrow you read the same three numbers from a graph and from a table, and compare the two ways.