Monday
Monday: The Bell Over the Bench
The long bench holds 200 seedlings for the Open House chart. "We cannot measure them all before Saturday," Comet says.
"Then measure 10, chosen by chance," Wren says. He draws cell numbers from a cup and reads them out.
Comet works down the bench with a ruler. "13, 13, 15, 15, 16, 16, 17, 17, 19, 19. Centimeters. What do you notice?"
"They pile up near 16 and thin out both ways," Wren says. "Mean 16. The spread is about 2 either side."
Nova projects a smooth bell over the dots. "Would you like a hint? A bell with those two numbers is a model for the whole bench."
"So about two thirds of all 200 should sit within 2 of 16," Comet says. "Without measuring them."
"That is what a sample is for," Wren says. "Ten readings, one careful claim about two hundred."
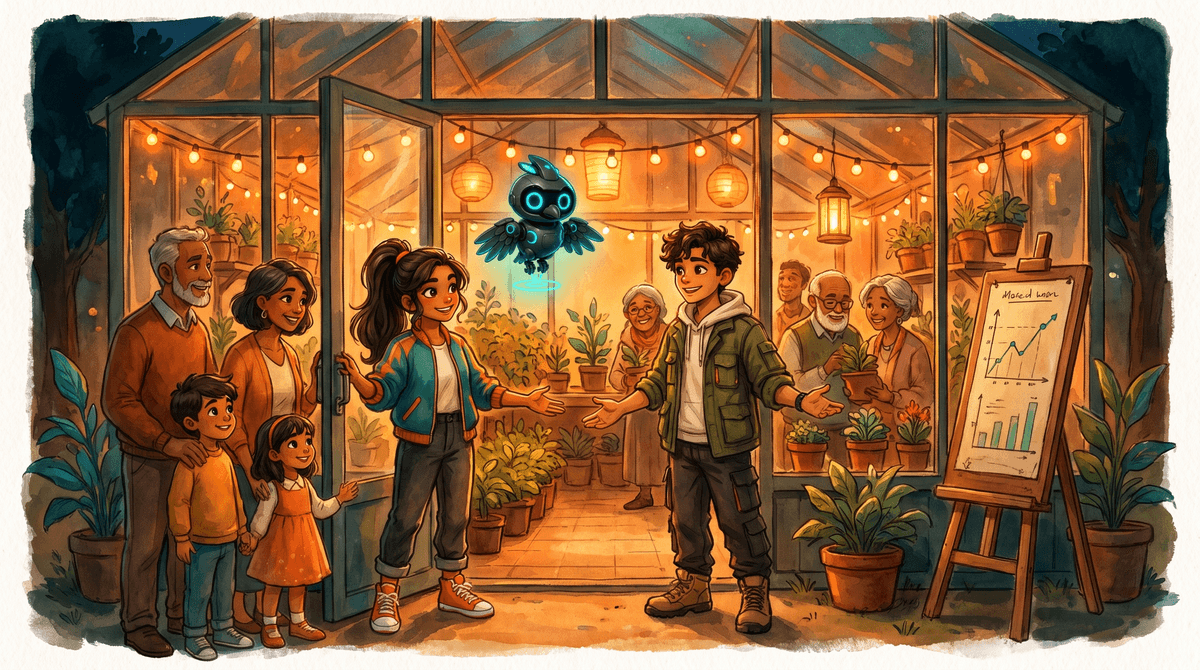
The crew's sample
Every height below is the crew's own made-up reading. The 10 cells were drawn from a cup, so the sample is random.
| Seedling | 1 | 2 | 3 | 4 | 5 | 6 | 7 | 8 | 9 | 10 |
|---|---|---|---|---|---|---|---|---|---|---|
| Height (cm) | 13 | 13 | 15 | 15 | 16 | 16 | 17 | 17 | 19 | 19 |
A solved problem to study
Here is how Wren finds the mean and the standard deviation.
- Add the 10 heights: 160. Divide by 10: the mean is 16.
- Find each height's distance from 16: -3, -3, -1, -1, 0, 0, 1, 1, 3, 3.
- Square each distance: 9, 9, 1, 1, 0, 0, 1, 1, 9, 9.
- Average the squares: 40 ÷ 10 = 4.
- Take the square root: the standard deviation is 2.
The standard deviation is a typical distance from the mean. Here most seedlings sit within 2 cm of 16 cm, and a few sit about 4 cm away.
Squaring makes every distance positive and lets big misses count more. The square root brings the units back to centimeters.
The normal model
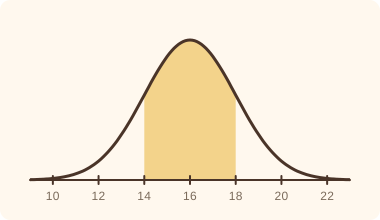
A data set that piles up in the middle and thins out evenly on both sides fits a bell curve. The mean and standard deviation set the bell.
The 68-95-99.7 rule: about 68% of the model lies within one standard deviation of the mean. About 95% lies within two, and 99.7% within three.
For the bench: about 68% of the 200 seedlings, around 136, should measure between 14 and 18 cm.
About 95%, around 190, should fall between 12 and 20 cm. These are estimates from a model, not counts.
When the bell does not fit
Another tray is lopsided: 2, 2, 3, 3, 3, 4, 4, 5, 9, 15 cm. Most are tiny and two grew tall. Its mean is 5 and its standard deviation 3.8.
Two standard deviations below the mean is -2.7 cm, a height below zero. The bell does not fit a lopsided set, and the rule should not be used on it.
- Read the question.
- Tap your answer.
Heights follow a normal model with mean 16 and standard deviation 2. About what percent are between 14 and 18?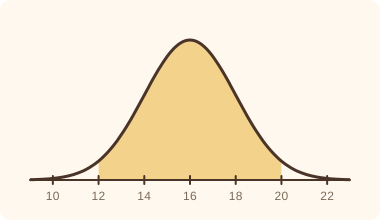 Heights follow a normal model with mean 16 and standard deviation 2. About what percent are between 12 and 20?
- Read the question.
- Tap your answer.
| Statement | True or false? |
|---|---|
| About 68% of a normal model lies within one standard deviation of the mean. | ? |
| 160 ÷ 10 = 16 | ? |
| The standard deviation is the distance from the lowest value to the highest. | ? |
| The normal model fits every data set, including a lopsided one. | ? |
| 16 + 2 × 2 = 20 | ? |
A strong start. Tomorrow you sort three kinds of studies and learn what each one is allowed to claim.